-
Chapter 15: MISCELLANEOUS - Clock and Data Interpretations
Data interpretation - Use both tables below
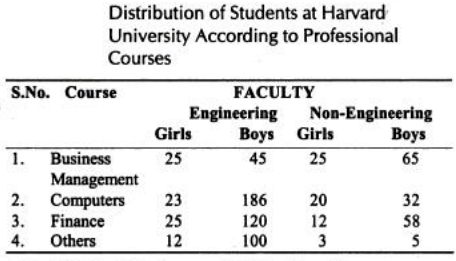
Ans .
62
- Explanation :
the boys to girls ratio is 4:1 that means we get 62% by taking weighted average.
Ans .
Business mgmt
- Explanation :
visual representation gives us business management as the answer.
Ans .
63.1
- Explanation :
101/160 = 63.1%
Ans .
none
- Explanation :
25/85 = 5/17 = 30% approx
Ans .
321
- Explanation :
(611-145)/145 = 321.4%
Data interpretation - Use both tables below
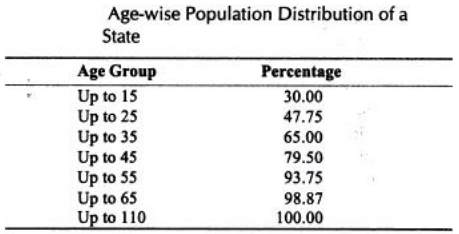
Ans .
15 - 35
- Explanation :
visual interpretation gives 15-35 has 35% which is the max
Ans .
191000
- Explanation :
47.75% of 400000
Ans .
3.15 million
- Explanation :
since 65% correspond to 40 million then 5.12% correspond to 3.15 million
Ans .
11.2
- Explanation :
6.25% people belong to the age group 56+ and this corresponds to 20 million. then 3.5% is 11.2 million
Ans .
130
- Explanation :
3% is 3.9 million and so 100% is 130 million
Ans .
1:1
- Explanation :
35% of the population is in both age groups so answer is 1:1
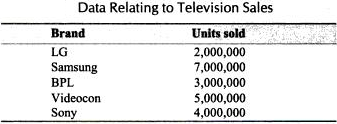
Data interpretation - Use both tables below
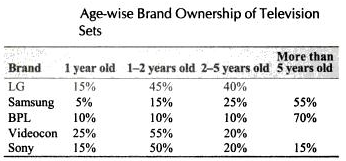
Ans .
65.5
- Explanation :
55% samsung + 70% BPL + 15% sony = 65.5 lac
Ans .
videocon
- Explanation :
videocon sold 25% of its 50 lac TV sets in the lasst year. this value is higher than sales of any other TV
Ans .
177.75
- Explanation :
210 - 0.5*65.5 = 177.75
Data interpretation
Ans .
cant say
- Explanation :
data gives brandwise ownership by age not marketshare details
Ans .
450000
- Explanation :
90% of the total BPL sets sold are over one year old
Ans .
cant say
- Explanation :
no information is available about this
Ans .
cant say
- Explanation :
no information is available about this
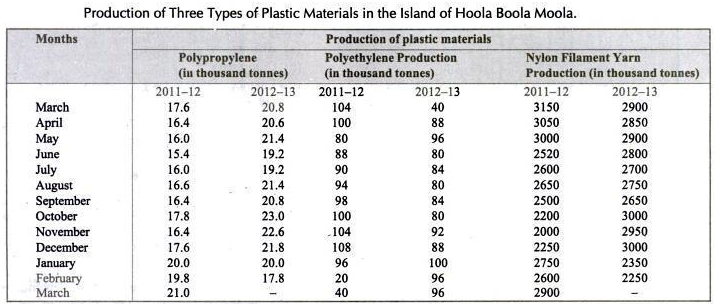
Data interpretation
Ans .
16
- Explanation :
88/5.6 = 16
Ans .
5
- Explanation :
100/20 = 5
Ans .
polypropylene
- Explanation :
happens once for polypropylene in january
Ans .
1
- Explanation :
statement is true for one month
Ans .
0.4
- Explanation :
2.4/6 = 0.4
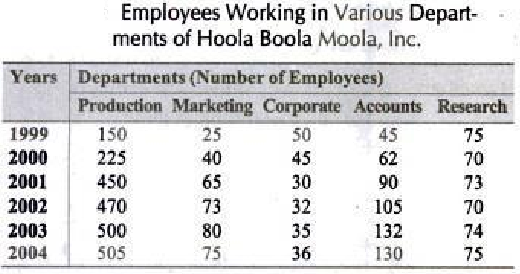
Data interpretation
Ans .
2001
- Explanation :
total of 1999 is 345 and it crossed 690 in 2001
Ans .
research
- Explanation :
Employees in research is the same in 1999 - 2004
Ans .
5
- Explanation :
This happens every year after 2000, hence 5 is the answer
Ans .
2003
- Explanation :
2003 is the only year
Ans .
marketing
- Explanation :
marketing is the only department that has this trend
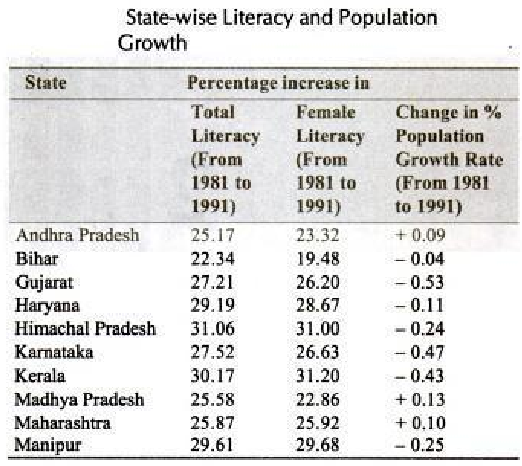
Data interpretation
Ans .
1,3
- Explanation :
Maharashtra and kerela show the value
Ans .
558.5
- Explanation :
bihar shows the minimum % increase. 22.34/0.04 = 558.5
Ans .
kerela
- Explanation :
kerelas ratio is maximum. here we observe the numerator and denominator.
Ans .
0.89
- Explanation :
average of the second column divided by the average of the haryana, HP, kerela, karnataka, and manipur.
Ans .
0.968
- Explanation :
ratio of sum of second column to sum of the first column.
Ans .
Cant say
- Explanation :
data is given for percentage literacy and so we cant say.
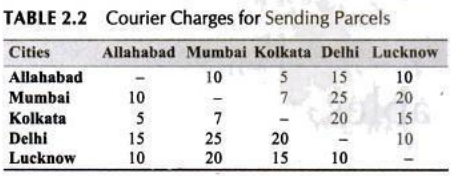
Data interpretation - Table shows the charges in Rs. for sending a parcel of 1 kg from one city to another.
Ans .
kolkata to mumbai
- Explanation :
kolkata to mumbai costs Rs. 7 which is the least
Ans .
allahabad
- Explanation :
kolkata to allahabad will be least
Ans .
delhi to mumbai
- Explanation :
other than delhi to mumbai at rs. 25 all others cost Rs. 10
Ans .
delhi
- Explanation :
mumbai is farthest from delhi and the cost is the highest
Ans .
no variance
- Explanation :
both the costs are 20
Ans .
all of these
- Explanation :
all have the same costs
Introduction
Q. In a 1 km race, A beats B by 28 m or 7 seconds. Find A's time on the course.
A. B covers 28 m in 7 secs so for a 1 km race he will need 7000 / 28 = 250secs
A needs 7 secs less so 243 secs i.e. 4 min 3 secs.
Q. A runs 1 3/4 times as fast as B. If B gets a start of 84m how far must the winning post be so that both reach at the same time?
A. Let the winning post be 'x' m. Since both have to reach at same time we equate time. Time = Distance / Speed.
x/7y/4 = (x-84)/y
4x/7y = (x-84)/y
4x = 7x - 588
588 = 3x and we get x = 196m
Clock
| In 60 minutes, the minute hand gains 55 minutes on the hour hand. |
Q. Find the angle between the hour hand and the minute hand at 3:25
A. Hour hand covers 360 degree in 12 hours so the angle it covers in 3 hrs 25 mins or 3 25/60 hrs = 3 5/12 = 41/12 hrs is (360 / 12) * (41/12) = 102 1/2吏�.
Angle traced by minute hand in 25 mins = ( 360 / 60 ) * (25) = 150吏�
Angle at 3:25 = 150 - 102.5 = 47.5吏�
Q. At what time between 2 and 3 'o clock will the hour and the minute hand will be together.
A. In 60 minutes, the minute hand gains 55 minutes on the hour hand.
The minute hand is at 12 and hour hand is at 2. The minute hand must gain 10 mins to meet the hour hand. So 60 * 10 / 55 = 120/11 mins the minute hand shall gain 10 mins and be together with hour hand.
Q. At what time between 4 and 5 pm shall the hour and minute hand be at right angles ?
A. To be at right angles the minute hand must be 15mins behind the hour hand. At 4 pm it is 20 mins behind so it must gain 5 mins. We know that it gains 55 mins in 60 mins so to gain 5 mins
60 * 5 / 55 = 60/11 mins.
Data Interpretation
Q.
| 2006 Data of cities |
2006 Data of population in thousands |
2006 Data of number of offenders |
2006 Data of number of 18-28 year olds in
thousands |
1999 data of number of offenders |
| A | 129.2 | 380 | 20.4 | 396 |
| B | 118 | 392 | 16.9 | 380 |
| C | 72.4 | 273 | 7.3 | 214 |
| D | 25.1 | 166 | 6.3 | 176 |
1. Which city has highest percentage of 18-28 year olds in 2006.
A. D
2. Relative to population which city has lowest rate of offenders in 2006?
A. A
3. Which city had the largest % decrease in number of offenders between 1999 and 2006?
A. D
Q.
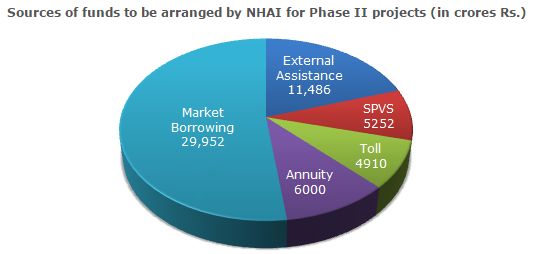
1. Total funds are how much.
A. 57600
2. How much of total share comes from borrowing in %.
A. 52%
Quiz
Score more than 80% marks and move ahead else stay back and read again!