-
Chapter 15: Data interpretation - Bar Charts
Data interpretation - Use Bar Charts

Ans .
122
- Explanation :
the percentage increase is 40-18/18 = 122 approx
Ans .
1997
- Explanation :
30000+18000=48000, which is sales in 1997
Ans .
- Explanation :
lowest rate of change is in 1 and 2 which is 16.66%
Ans .
18000
- Explanation :
48000-30000=18000
Data interpretation - Use Bar Charts
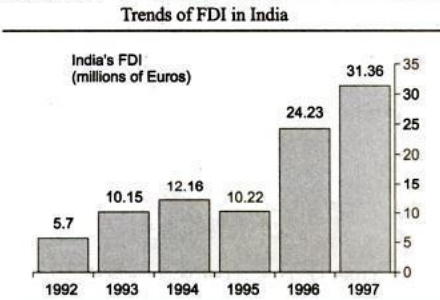
Ans .
93.82
- Explanation :
5.7+10.15+12.16+10.22+24.23+31.26=93.82
Ans .
11.13
- Explanation :
11.13
Ans .
5.5
- Explanation :
31.36/5.7
Ans .
1996
- Explanation :
FDI in 1996 is double that of the year 1995
Ans .
11
- Explanation :
2/5.7 = x/31.36
Data interpretation - Use Bar Charts
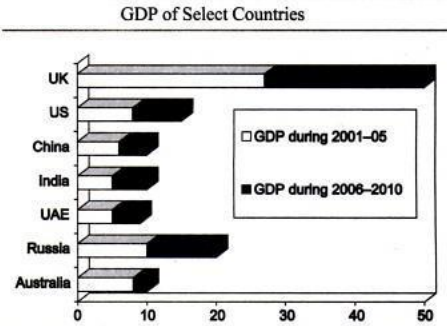
Ans .
russia
- Explanation :
by observation we get russia
Ans .
USA
- Explanation :
by observation we get USA as the option as it is the highest.
Ans .
none
- Explanation :
russia accounts for 10 out 125 i.e 8% of the total which gives 800 out of 10000
Ans .
1/5th
- Explanation :
10/50 is 1/5th
Data interpretation - Use Bar Charts
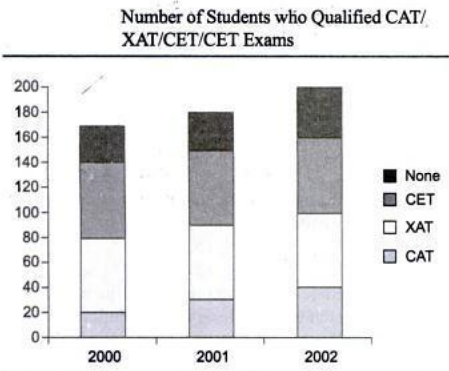
Ans .
11.76
- Explanation :
20*100/170
Ans .
82.35
- Explanation :
140*100/170
Ans .
2001
- Explanation :
140/170 < 150/180 > 160/200
Ans .
17.64
- Explanation :
30*100/170
Data interpretation - Use Bar Charts
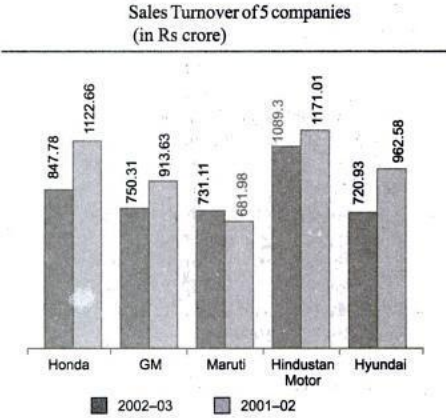
Ans .
142.48
- Explanation :
difference between the sum of the two years divided by 5
Ans .
962.76
- Explanation :
GM should have increased its sales turnover by 49.13 crore so we get 913.63 + 49.13 = 962.76
Ans .
hyundai
- Explanation :
hyundai with 25.25 is marginally higher than honda with 24.5
Ans .
- Explanation :
100- (percentage value of the fraction)
Ans .
712.43
- Explanation :
absolute value of the difference between the sum of turnover of the companies for the year 2001-02 and 2002-03
Data interpretation - Use Bar Charts
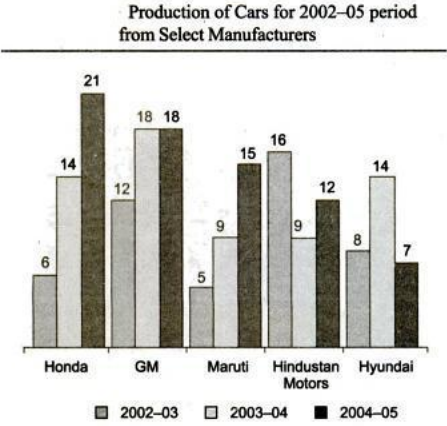
Ans .
1.5
- Explanation :
required ratio is 9/6 = 1.5
Ans .
3
- Explanation :
honda, GM and maruti have not shown a decrease
Ans .
3
- Explanation :
average sales of different companies are honda = 6+14+21/3 = 13.66, GM = 12+18+18/3 = 16; Maruti = 5+9+15/3 = 9.66; HM = 16+9+12/3 = 12.33; Hyundai = 8+14+7/3 = 9.66
Data interpretation - Use Bar Charts
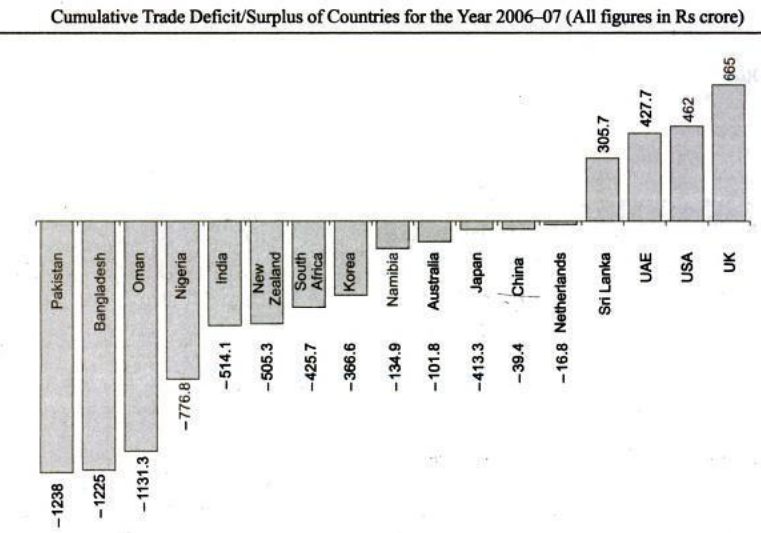
The total of the first three deficit countries in Rs crores is 3594.3. The total of the next five deficit countries in Rs crores is 2588.5. The total of the last five deficit countries in Rs crores is 334.2. The total of the four surplus countries in Rs crores iis 1860.4.
Ans .
USA
- Explanation :
the average surplus of the four countries is 1860.4/4 = 465.1. so usa is closest
Ans .
0.75
- Explanation :
4885.2/6517
Ans .
korea
- Explanation :
middle five deficit countries are india, NZ, south africa, korea, namibia. their average deficit is 1946.6/5 = 389.32. koreas deficit is closest to this value.
Ans .
4656.6 deficit
- Explanation :
adding all surplus and subtracting all deficits we get this value
- Explanation :
360/94
Data interpretation - Use Bar Charts
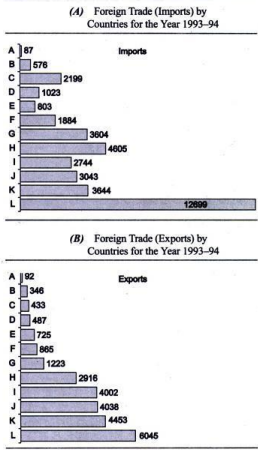
- Explanation :
Out of a total of 12 countries, 8 showed a deficit while 4 showed a surplus.
- Explanation :
Visually it is clear that L has the highest trade deficit.
- Explanation :
I has a ratio of 400212744 = 1.45, which is the highest.
- Explanation :
Sum of exports-sum of imports =deficit (11286).
- Explanation :
6045/87
Data interpretation - Use Bar Charts
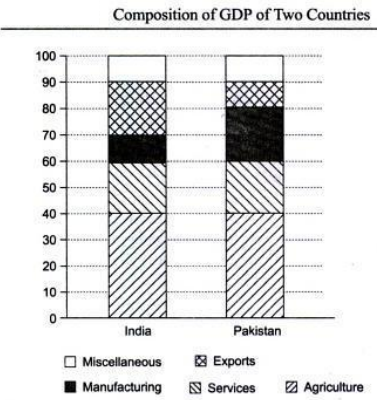
The above bar chart shows the composition of the ODE of two countries (India and Pakistan).
- Explanation :
Services accounts for 20%, i.e., 1/51h of the GDP of India.
- Explanation :
20% of 10000 = 2000
- Explanation :
(40+20+10)% of 30,000 = Rs 21,000 crore.
- Explanation :
Although the percentage on Services and Miscellaneous put together is equal for both the countries, we cannot
comment on this since we have no data about the respective GDPs
- Explanation :
Since the GDP is same, the answer will be by (40-20)120 = 100%.