Bias / Variance
Almost all the really good machine learning practitioners tend to be very sophisticated in understanding of Bias and Variance.
Bias and Variance is one of those concepts that's easily learned but difficult to master.
Even if you think you've seen the basic concepts of Bias and Variance, there's often more new ones to it than you'd expect.
In the Deep Learning Era, another trend is that there's been less discussion of what's called the bias-variance trade-off.
In Deep Learning Era there's less of a trade-off, so we'd still still solve the bias, we still solve the variance, but we just talk less about the bias-variance trade-off.
Let's see what this means.
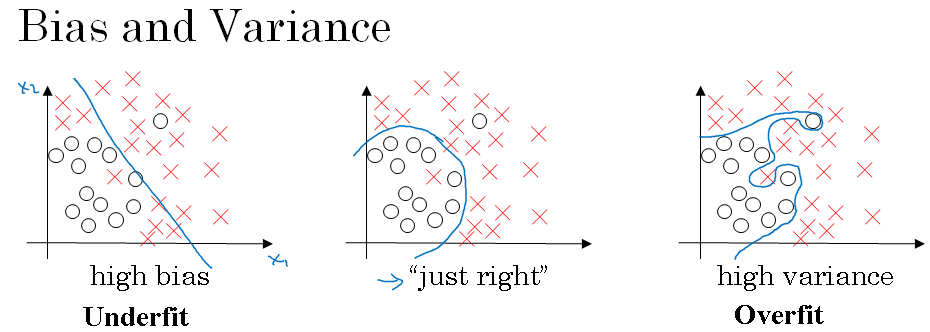
Let's see the data set that looks like this.
If you fit a straight line to the data, maybe get a logistic regression fit to that. This is not a very good fit to the data. And so this is class of a high bias, what we say that this is underfitting the data.
On the opposite end, if you fit an incredibly complex classifier, maybe deep neural network, or neural network with all the hidden units, maybe you can fit the data perfectly, but that doesn't look like a great fit either.
So there's a classifier of high variance and this is overfitting the data.
And there might be some classifier in between, with a medium level of complexity, that maybe fits it correctly like that. That looks like a much more reasonable fit to the data, so we call that just right.
It's somewhere in between. So in a 2D example like the one shown above, with just two features, X-1 and X-2, you can plot the data and visualize bias and variance.
In high dimensional problems, you can't plot the data and visualize division boundary.
Instead, there are couple of different metrics, that we'll look at, to try to understand bias and variance.
Bias / Variance - Human level performance
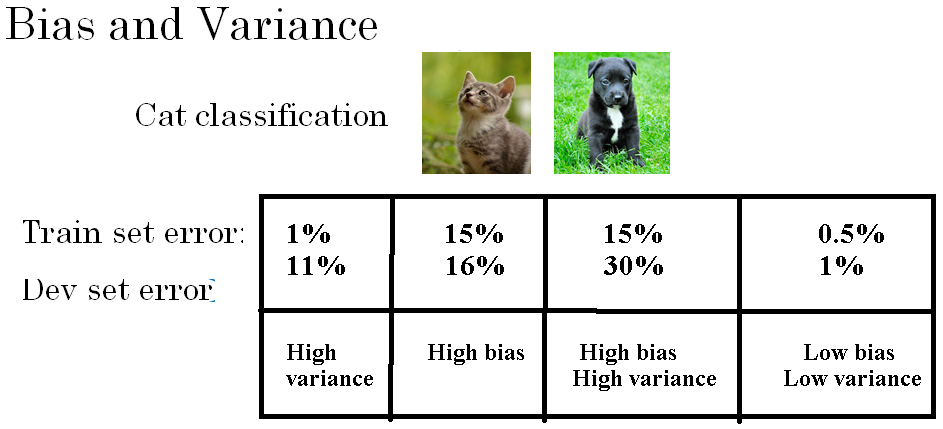
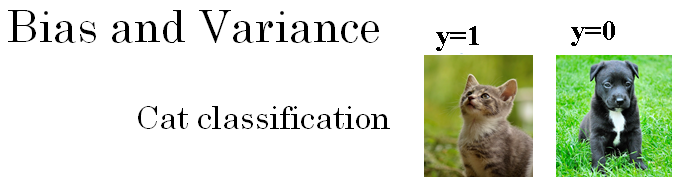
For an example of cat picture classification, where below figure shows a positive example and a negative example, the two key numbers to look at to understand bias and variance will be the train set error and the dev set or the development set error.
For the sake of argument, let's say that you're recognizing cats in pictures, is something that people can do nearly perfectly, right? So let's say, your training set error is 1% and your dev set error is, for the sake of argument, let's say is 11%.
In this example, you're doing very well on the training set, but you're doing relatively poorly on the development set.
This looks like you might have overfit the training set, that somehow you're not generalizing well, to this whole cross-validation set in the development set.
And so if you have an example like this, we would say this has high variance. By looking at the training set error and the development set error, you would be able to render a diagnosis of your algorithm having high variance.
Now, let's say, that you measure your training set and your dev set error, and you get a different result.
Let's say, that your training set error is 15%. And your dev set error is 16%. In this case, assuming that humans achieve roughly 0% error, that humans can look at these pictures and just tell if it's cat or not, then it looks like the algorithm is not even doing very well on the training set.
So if it's not even fitting the training data set that well, then this is underfitting the data.
And so this algorithm has high bias.
But in contrast, this actually generalizing at a reasonable level to the dev set, whereas performance in the dev set is only 1% worse than performance in the training set.
So this algorithm has a problem of high bias, because it was not even fitting the training set.
Bias / Variance - Example
Let's say that you have 15% training set error, so that's pretty high bias, but when you evaluate to the dev set it does even worse, maybe 30%.
In this case, we would diagnose this algorithm as having high bias, because it's not doing that well on the training set, and high variance.
So this has really the worst of both worlds.
And one last example, if you have 0.5 training set error, and 1% dev set error, then maybe our users are quite happy, that you have a cat classifier with only 1%, than just we have low bias and low variance.
One subtlety, that I'll just briefly mention that we'll leave to a later video to discuss in detail, is that this analysis is predicated on the assumption, that human level performance gets nearly 0% error or, more generally, that the optimal error, sometimes called bayes error, so the bayesian optimal error is nearly 0%.
Skipping details to a further section, it turns out that if the optimal error or the bayes optimal error were much higher, say, it were 15%, then if you look at this classifier, 15% is actually perfectly reasonable for training set and you wouldn't see it as high bias and also a pretty low variance.
So the case of how to analyze bias and variance, when no classifier can do very well, for example, if you have really blurry images, so that even a human or just no system could possibly do very well, then maybe bayesian error is much higher, and then there are some details of how this analysis will change.
But leaving aside this subtlety for now, the takeaway is that by looking at your training set error you can get a sense of how well you are fitting, at least the training data, and so that tells you if you have a bias problem.
And then looking at how much higher your error goes, when you go from the training set to the dev set, that should give you a sense of how bad is the variance problem, so you'll be doing a good job generalizing from a training set to the dev set, that gives you sense of your variance.
All this is under the assumption that the bayes error is quite small and that your training and your dev sets are drawn from the same distribution.
If those assumptions are violated, there's a more sophisticated analysis you could do, which we'll talk about in the later section.
Now, that you saw what high bias, high variance looks like, lets see what does high bias and high variance looks like?
This is kind of the worst of both worlds.
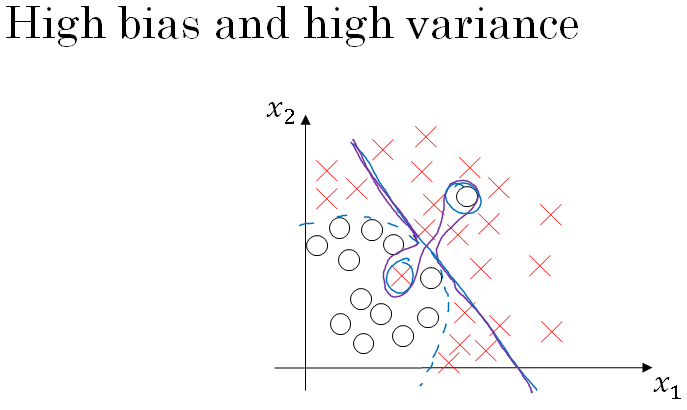
For a classifier like shown above, your classifier has high bias, because it underfits the data. So this would be a classifier that is mostly linear and therefore underfits the data, we're drawing this in purple in the figure above.
But if somehow your classifier does some weird things, then it is actually overfitting parts of the data as well.
So the classifier that we drew in purple, has both high bias and high variance. Where it has high bias, because, by being a mostly linear classifier, is just not fitting.
You know, this quadratic line shape that well, but by having too much flexibility in the middle, it somehow gets this example, and this example overfits those two examples as well. So this classifier kind of has high bias because it was mostly linear, but you need maybe a curve function or quadratic function.
And it has high variance, because it had too much flexibility to fit those two mislabel, or those live examples in the middle as well. In case this seems contrived, well, this example is a little bit contrived in two dimensions, but with very high dimensional inputs. You actually do get things with high bias in some regions and high variance in some regions, and so it is possible to get classifiers like this in high dimensional inputs that seem less contrived.
So to summarize, you've seen how by looking at your algorithm's error on the training set and your algorithm's error on the dev set you can try to diagnose, whether it has problems of high bias or high variance, or maybe both, or maybe neither.
And depending on whether your algorithm suffers from bias or variance, it turns out that there are different things you could try.
So in the next section, we want to present to you, a basic recipe for Machine Learning, that lets you more systematically try to improve your algorithm, depending on whether it has high bias or high variance issues. So let's go on to the next video.