Probability Trees: Defined
When two categorical variables are involved, we have displayed counts or probabilities for various events with two-way tables and with Venn diagrams.
Another display tool, called a probability tree, is particularly useful for showing probabilities when the events occur in stages and conditional probabilities are involved.
Example A sales representative tells his friend that the probability of landing a major contract by the end of the week, resulting in a large commission, is .4. If the commission comes through, the probability that he will indulge in a weekend vacation in Bermuda is .9. Even if the commission doesn't come through, he may still go to Bermuda, but only with probability .3.
First, let's identify the given probabilities for events involving C (the commission comes through) and V (the sales rep takes a Bermuda vacation):
P(C) = 0.4 [and so P(not C) = 0.6],
P(V | C) = 0.9 [and so P(not V | C) = 0.1], and
P(V | not C) = 0.3 [and so P(not V | not C) = 0.7.]
There are two stages in the problem. First, the sales rep will either get the commission or not.
Second, based on what happened in the first stage, the sales rep will either take the Bermuda vacation or not.
We follow exactly the same reasoning when we build the probability tree.
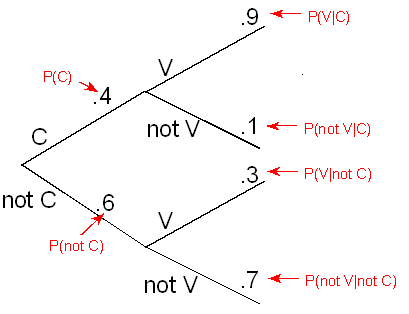
The first branch off represents the first stage - the sales representative either gets the commission or does not get the commission.
We are given that the probability of getting the commission is 0.4 and therefore by the complement rule the probability of not getting the commission must be 0.6.
If event C occurs in stage one - in other words, if the sales representatives gets the commission - a second branch off represents the two options of stage two: the rep will either take the Bermuda vacation or not.
We're given that in the event that the sales representative gets the commission he will take the vacation with probability 0.9 which means that the probability that he will not take the vacation must be 0.1.
Similarly, if event "not C" occurs in stage one - in other words, if the sales representative does not get the commission - a second branch off represents the two options in stage two: the sales rep either takes the vacation or not.
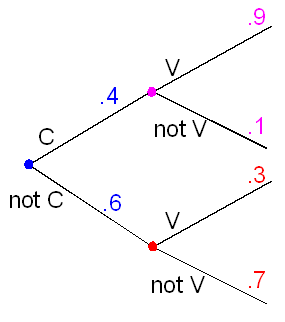
We are told that in this case the probability that the rep will take the vacation is only 0.3, which means by the complement rule that he will not take the vacation with probability 0.7. Here is the completed probability tree.
There are two important things to note here :
The probabilities in the first branch-off are non-conditional probabilities P(C) = 0.4, P(not C) = 0.6. However, the probabilities that appear in the second branch-off are conditional probabilities. The top two branches assume that C occurred: P(V | C) = 0.9, P(not V | C) = 0.1. The bottom two branches assume that not C occurred: P(V | not C) = 0.3, P(not V | not C) = 0.7
The second thing to note is that probabilities of branches that branch out from the same point always add up to one.
Probability Trees: Example
An overheating engine can quickly cause serious damage to a car, and therefore a dashboard red warning light is supposed to come on if that happens. In a certain model car, there is a 3% chance of the engine overheating (event H). The probability of the warning light showing up (event W) when it should (i.e., when the engine is really overheating) is 0.98, however, 1% of the time the warning light appears for no apparent reason (i.e., when the engine temperature is normal).
In an activity in the previous part we identified the information that this problem provides:
P(H) = 0.03
P(W | H) = 0.98
P(W | not H) = 0.01
A correct representation of the given information in a probability tree ?
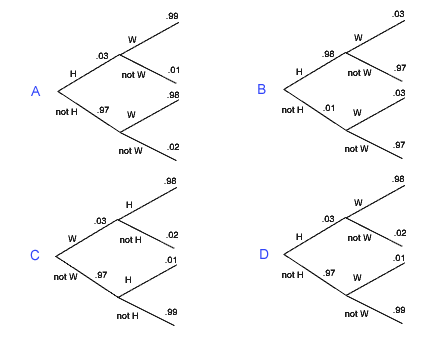
Note that the tree you chose depicts the fact that the natural order is that H happens first (engine overheats), and then W (warning light shows up). The probabilities of each branch are also correct, starting with the non-conditional probabilities for the first branch-off, and conditional probabilities for the second branch-off, making sure that the probabilities of branches branching off the same point add up to 1.
Probability Trees: Example
Example What is the overall probability that the sales rep will take the Bermuda vacation?
Notice that a V branch can be reached by either a C or a not C branch: either the sales rep gets the commission and takes the vacation, or he does not get the commission and he takes the vacation. Symbolically, V = (C and V) or (not C and V). Thus, the overall probability of taking the vacation is
P(V) = P( (C and V) or (not C and V) ).
Applying the Addition Rule for Disjoint Events, we have
P(V) = P(C and V) + P(not C and V).
Applying the General Multiplication Rule to each term, we have
P(V) = P(C) * P(V | C) + P(not C) * P(V | not C) = 0.4 * 0.9 + 0.6 * 0.3 = 0.36 + 0.18 = 0.54.
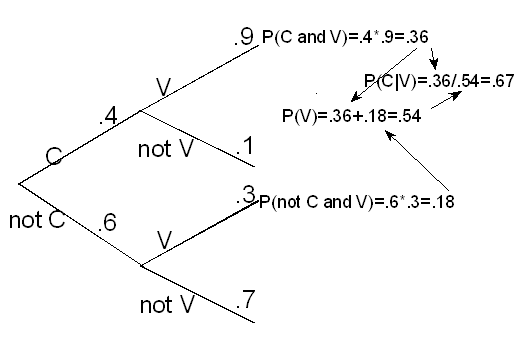
The overall probability that the sales rep will take the Bermuda vacation is 0.54. The tree diagram below shows the probabilities obtained via the general multiplication rule, and then the addition rule
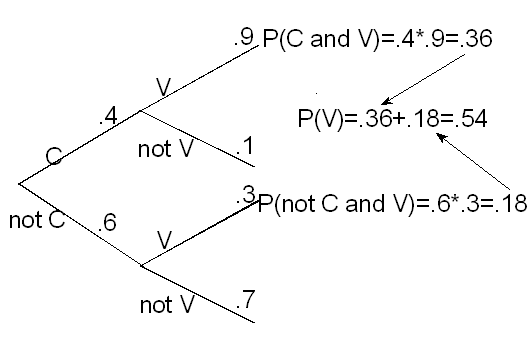
Comment : Following one branch to a connected branch, such as C then V, represents the occurrence of one event and then another, which requires multiplication of probabilities. Including outcomes reached via either of two end-branches represents the occurrence of one event or another, which requires addition of probabilities.
In order to illustrate the background situation of either getting the commission or not—which together make up the whole sample space S—along with the follow-up circumstance of either taking the vacation or not, we can draw a different sort of Venn diagram:
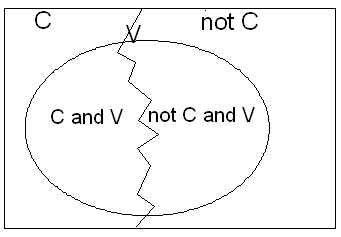
The diagram shows that V = (C and V) or (not C and V), where (C and V) and (not C and V) are disjoint. Applying first the Addition Rule for Disjoint Events and then the General Multiplication Rule, we have P(V) = P(C and V) + P(not C and V) = P(C) * P(V | C) + P(not C) * P(V | not C), just as we saw in our tree diagram.
We can generalize our solution to obtain an expression for the probability of any event B, based on how B is impacted by the occurrence or non-occurrence of some other event A. We call this the Law of Total Probability: P(B) = P(A) * P(B | A) + P(not A) * P(B | not A).
Example Suppose the friend finds out that the sales rep has left for Bermuda. Is it likely that the commission came through? Find the probability that the commission came through, given that the sales rep went to Bermuda.
Here, we are asked to find the probability that the commission came through, given that the sales rep took his Bermuda vacation, P(C | V). Using the definition of conditional probability,
P(C | V) = P(C and V) / P(V)
and now, using the tree, and our result from part (a) (P(V) = 0.54)), we get that:
P(C | V) = P(C and V) / P(V) = 0.36/0.54 = 0.67
Thus, if it is known that the sales rep left for the Bermuda vacation, it is more likely than not that the commission came through.
Comment : Ordinarily, when events occur in stages, the explanatory variable would be the occurrence or non-occurrence of a certain event at the first stage, and the response variable would be the occurrence or non-occurrence of the next event chronologically. In such cases, we would identify the probability of a certain response, given that the explanatory variable took a certain value. However, there are sometimes situations, as in the second example above, where what we know is the ultimate outcome, and what we want to find out is the probability that a certain event occurred previously. Our solution to that example suggests a general formula for solving problems of this form:
[our expression for a conditional probability] \( P(A|B) = \frac{P(A \cap B)}{P(B)} \)
[by the General Multiplication Rule] \( P(A|B) = \frac{P(A) * P(B|A) }{P(B)} \)
[by the Law of Total Probability] \( P(A|B) = \frac{P(A) * P(B|A) }{P(A) * P(B|A) + P(not A) * P(B|not A) } \)
The fact that P(A | B) equals the latter expression is known as Bayes' Rule, or Bayes' Theorem.
Probability Trees: Applications
Example : Polygraph (lie-detector) tests are often routinely administered to employees or prospective employees in sensitive positions. A National Research Council study in 2002, headed by Stephen Fienberg from CMU, found that lie detector results are "better than chance, but well below perfection." Typically, the test may conclude someone is a spy 80% of the time when he or she actually is a spy, but 16% of the time the test will conclude someone is a spy when he or she is not.
Let us assume that 1 in 1,000, or 0.001, of the employees in a certain highly classified workplace are actual spies.
Let S be the event of being a spy, and D be the event of the polygraph detecting the employee to be a spy.
Let's first express the information using probability notations involving events S and D.
We are given:
1 in 1,000, or 0.001, of the employees are actual spies. = P(S) = 0.001
the test may conclude someone is a spy 80% of the time when he or she actually is a spy = P(D | S) = 0.80
16% of the time, the test will conclude someone is a spy when he or she is not --> P(D | not S) = 0.16
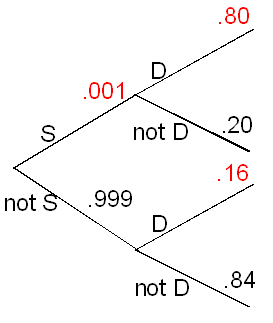
Let's create a tree diagram for this problem, starting, as usual, with the event for which a non-conditional probability is given, S. It also makes sense that we start with S, since the natural order is that first a person becomes a spy, and then he/she is either detected or not.
Note that marked in red are the probabilities that are given, and the rest are completed using the Complement Rule as explained before.
What is the probability that a randomly chosen employee is not a spy, and the test does not detect the employee as one? In other words what is P(not S and not D)?
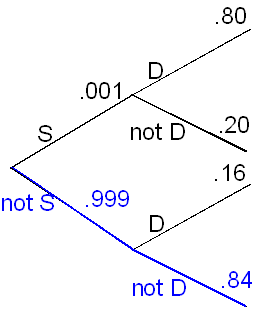
P(not S and not D) = P(not S) * P(not D | not S) = 0.999 * 0.84 = 0.83916
What is the probability that a randomly chosen employee is a spy, and the test does not detect the employee as one? [This would be an incorrect conclusion.] In other words, what is P(S and not D)
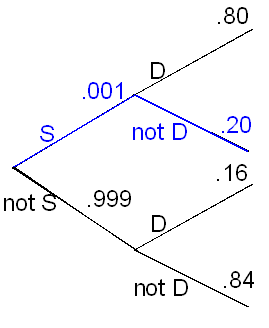
P(S and not D) = P(S) * P(not D | S) = 0.001 * 0.20 = 0.0002
Suppose the polygraph detects a spy; are you convinced that the employee is actually a spy? Find the probability of an employee actually being a spy, given that the test claims he or she is. In other words, find P(S | D).
Applying Bayes' Rule, we have
P(S | D) = P(S) * P(D | S) / [P(S) * P(D | S) + P(not S) * P(D | not S)]
=0.001 * 0.80 / [0.001 *0 .80 + 0.999 * 0.16] = 0.0008/0.16064 = 0.005
The study's conclusion, that more accurate tests than the traditional polygraph are sorely needed, is supported by our answer to part (d): if someone is detected as being a spy, the probability is only 0.005, or half of one percent, that he or she actually is one.
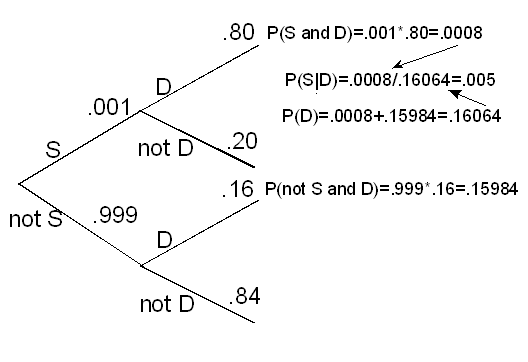
Comment : This example helps to highlight how different P(B | A) may be from P(A | B): the probability of being detected, given that an employee is a spy, is P(D | S) = 0.80. In contrast, the probability of being a spy, given that an employee has been detected by the polygraph, is P(S | D) = 0.005.
Probability Trees: Scenario: Overheating Engine
Let's consider the engine overheating example again, where H is the event that the engine overheats, and W is the event that a warning light turns on. We are given that: P(H) = 0.03; P(W | H) = 0.98; P(W | not H) = 0.01 and in a previous activity we displayed the information using a probability tree:
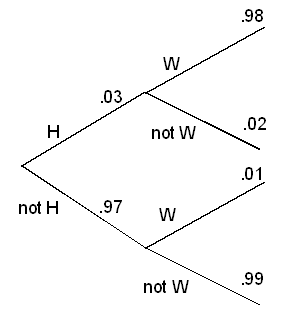
What is the probability that the warning light shows up, P(W)? (Recall from previous examples that you need to consider two possibilities here, since a W branch can be reached in two ways. Either the engine is overheated and the warning light is on, or the engine is not overheated and the warning light is on.)
The two possibilities that we need to consider here are: P(W) = P(H and W) + P(not H and W) = 0.03 * 0.98 + 0.97 * 0.01 = 0.0294 + 0.0097= 0.0391
When a driver notices that the warning light is on, how worried does he or she need to be? In other words, given that the warning light is on, how likely is it that the engine is really overheating? Use the definition of conditional probability, and the information you obtained in the previous question, to find P(H | W).
By the definition of conditional probability, P(H | W) = P(H and W) / P(W). In the first question we found that P(H and W) = .0294, and that P(W) = .0391. Therefore: P(H | W) = .0294/.0391 = .752. This means that when the warning light is on, there is about a 75% chance that the engine is indeed overheating, and therefore it is advisable for the driver to stop the car and let the engine cool down.