Prioritizing What to Work On : System Design Example
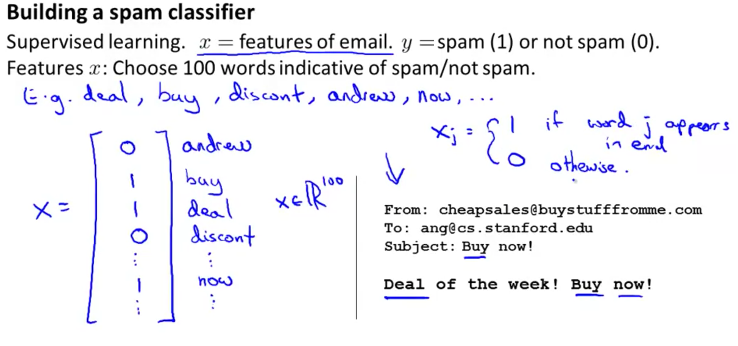
Given a data set of emails, we could construct a vector for each email. Each entry in this vector represents a word.
The vector normally contains 10,000 to 50,000 entries gathered by finding the most frequently used words in our data set.
If a word is to be found in the email, we would assign its respective entry a 1, else if it is not found, that entry would be a 0.
Once we have all our x vectors ready, we train our algorithm and finally, we could use it to classify if an email is a spam or not.
So how could you spend your time to improve the accuracy of this classifier?
Collect lots of data (for example "honeypot" project but doesn't always work)
Develop sophisticated features (for example: using email header data in spam emails)
Develop algorithms to process your input in different ways (recognizing misspellings in spam).
It is difficult to tell which of the options will be most helpful.
Error Analysis
The recommended approach to solving machine learning problems is to:
Start with a simple algorithm, implement it quickly, and test it early on your cross validation data.
Plot learning curves to decide if more data, more features, etc. are likely to help.
Manually examine the errors on examples in the cross validation set and try to spot a trend where most of the errors were made.
For example assume that we have 500 emails and our algorithm misclassifies a 100 of them.
We could manually analyze the 100 emails and categorize them based on what type of emails they are. We could then try to come up with new cues and features that would help us classify these 100 emails correctly.
Hence, if most of our misclassified emails are those which try to steal passwords, then we could find some features that are particular to those emails and add them to our model.
We could also see how classifying each word according to its root changes our error rate:
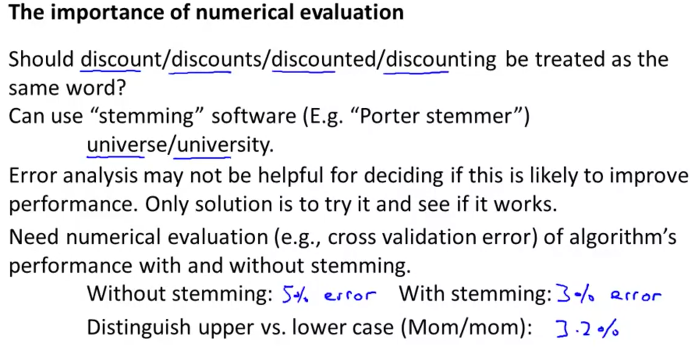
It is very important to get error results as a single, numerical value. Otherwise it is difficult to assess your algorithm's performance.
For example if we use stemming, which is the process of treating the same word with different forms (fail/failing/failed) as one word (fail), and get a 3% error rate instead of 5%, then we should definitely add it to our model.
However, if we try to distinguish between upper case and lower case letters and end up getting a 3.2% error rate instead of 3%, then we should avoid using this new feature.
Hence, we should try new things, get a numerical value for our error rate, and based on our result decide whether we want to keep the new feature or not.
Handling Skewed Data - Error metrics for skewed classes
In the context of evaluation and of error metrics, there is one important case, where it's particularly tricky to come up with an appropriate error metric, or evaluation metric, for your learning algorithm. That case is the case of what's called skewed classes.
Consider the problem of cancer classification, where we have features of medical patients and we want to decide whether or not they have cancer. So this is like the malignant versus benign tumor classification example that we had earlier.
Let's say y equals 1 if the patient has cancer and y equals 0 if they do not. We have trained the progression classifier and let's say we test our classifier on a test set and find that we get 1 percent error. So, we're making 99% correct diagnosis. Seems like a really impressive result, right. We're correct 99% percent of the time.
Now, let's say we find out that only 0.5 percent of patients in our training test sets actually have cancer. So only half a percent of the patients that come through our screening process have cancer. In this case, the 1% error no longer looks so impressive.
And in particular, here's a piece of code, here's actually a piece of non learning code that takes this input of features x and it ignores it. It just sets y equals 0 and always predicts, you know, nobody has cancer and this algorithm would actually get 0.5 percent error. So this is even better than the 1% error that we were getting just now and this is a non learning algorithm that you know, it is just predicting y equals 0 all the time.
So this setting of when the ratio of positive to negative examples is very close to one of two extremes, where, in this case, the number of positive examples is much, much smaller than the number of negative examples because y equals one so rarely, this is what we call the case of skewed classes.
We just have a lot more of examples from one class than from the other class. And by just predicting y equals 0 all the time, or maybe our predicting y equals 1 all the time, an algorithm can do pretty well. So the problem with using classification error or classification accuracy as our evaluation metric is the following.
Let's say you have one joining algorithm that's getting 99.2% accuracy. So, that's a 0.8% error. Let's say you make a change to your algorithm and you now are getting 99.5% accuracy. That is 0.5% error.
So, is this an improvement to the algorithm or not? One of the nice things about having a single real number evaluation metric is this helps us to quickly decide if we just need a good change to the algorithm or not. By going from 99.2% accuracy to 99.5% accuracy.
You know, did we just do something useful or did we just replace our code with something that just predicts y equals zero more often? So, if you have very skewed classes it becomes much harder to use just classification accuracy, because you can get very high classification accuracies or very low errors, and it's not always clear if doing so is really improving the quality of your classifier because predicting y equals 0 all the time doesn't seem like a particularly good classifier.
But just predicting y equals 0 more often can bring your error down to, you know, maybe as low as 0.5%. When we're faced with such a skewed classes therefore we would want to come up with a different error metric or a different evaluation metric. One such evaluation metric are what's called precision recall.
Let's say we are evaluating a classifier on the test set. For the examples in the test set the actual class of that example in the test set is going to be either one or zero, right, if there is a binary classification problem.
And what our learning algorithm will do is it will predict some value for the class and our learning algorithm will predict the value for each example in my test set and the predicted value will also be either one or zero.
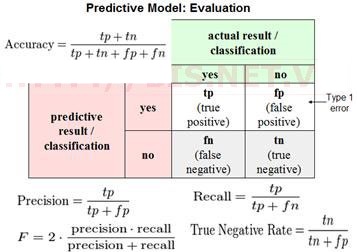
We draw a two by two table as follows, depending on a full of these entries depending on what was the actual class and what was the predicted class. If we have an example where the actual class is one and the predicted class is one then that's called a true positive, meaning our algorithm predicted that it's positive and in reality the example is positive.
If our learning algorithm predicted that something is negative, class zero, and the actual class is also class zero then that's what's called a true negative. We predicted zero and it actually is zero.
To find the other two boxes, if our learning algorithm predicts that the class is one but the actual class is zero, then that's called a false positive.
So that means our algorithm for the patient is cancelled out in reality if the patient does not.
And finally, the last box is a zero, one. That's called a false negative because our algorithm predicted zero, but the actual class was one.
And so, we have this little sort of two by two table based on what was the actual class and what was the predicted class.
So here's a different way of evaluating the performance of our algorithm. We're going to compute two numbers. The first is called precision - and what that says is, of all the patients where we've predicted that they have cancer, what fraction of them actually have cancer?
So lets write this down, the precision of a classifier is the number of true positives divided by the number that we predicted as positive, right?
So of all the patients that we went to those patients and we told them you have cancer. Of all those patients, what fraction of them actually have cancer? So that's called precision.
And another way to write this would be true positives and then in the denominator is the number of predicted positives, and so that would be the sum of the, you know, entries in this first row of the table.
So it would be true positives divided by true positives. So that's called precision, and as you can tell high precision would be good.
The second number we're going to compute is called recall, and what recall say is of all the patients that have cancer, how many of them did we actually go to them and correctly told them that we think they need treatment.
So, writing this down, recall is defined as the number of positives, the number of true positives, meaning the number of people that have cancer and that we correctly predicted have cancer and we take that and divide that by, divide that by the number of actual positives
And so we're much more sure that a classifier of a high precision or high recall actually is a good classifier, and this gives us a more useful evaluation metric that is a more direct way to actually understand whether, you know, our algorithm may be doing well.
So for the problem of skewed classes precision recall gives us more direct insight into how the learning algorithm is doing and this is often a much better way to evaluate our learning algorithms, than looking at classification error or classification accuracy, when the classes are very skewed.
Trade-off between precision and recall
For many applications, we'll want to somehow control the trade-off between precision and recall. Let me tell you how to do that and also show you some even more effective ways to use precision and recall as an evaluation metric for learning algorithms.
In cancer classification example, where y equals 1 if the patient has cancer and y equals 0 otherwise. And let's say we're trained in logistic regression classifier which outputs probability between 0 and 1.
So, we're going to predict 1, y equals 1, if h(x) is greater or equal to 0.5. And predict 0 if the hypothesis outputs a value less than 0.5. And this classifier may give us some value for precision and some value for recall.
Now, suppose we want to predict that the patient has cancer only if we're very confident that they really do. Because if you go to a patient and you tell them that they have cancer, it's going to give them a huge shock. What we give is a seriously bad news, and they may end up going through a pretty painful treatment process and so on.
And so maybe we want to tell someone that we think they have cancer only if they are very confident. One way to do this would be to modify the algorithm, so that instead of setting this threshold at 0.5, we might instead say that we will predict that y is equal to 1 only if h(x) is greater or equal to 0.7.
So this is like saying, we'll tell someone they have cancer only if we think there's a greater than or equal to, 70% chance that they have cancer.
And, if you do this, then you're predicting someone has cancer only when you're more confident and so you end up with a classifier that has higher precision.
Because all of the patients that you're going to and say we think you have cancer, although those patients are now ones that you're pretty confident actually have cancer.
And so a higher fraction of the patients that you predict have cancer will actually turn out to have cancer because making those predictions only if we're pretty confident.
But in contrast this classifier will have lower recall because now we're going to make predictions, we're going to predict y = 1 on a smaller number of patients. Now, can even take this further. Instead of setting the threshold at 0.7, we can set this at 0.9. Now we'll predict y = 1 only if we are more than 90% certain that the patient has cancer. And so, a large fraction of those patients will turn out to have cancer. And so this would be a higher precision classifier will have lower recall because we want to correctly detect that those patients have cancer.
Now consider a different example. Suppose we want to avoid missing too many actual cases of cancer, so we want to avoid false negatives. In particular, if a patient actually has cancer, but we fail to tell them that they have cancer then that can be really bad.
Because if we tell a patient that they don't have cancer, then they're not going to go for treatment. And if it turns out that they have cancer, but we fail to tell them they have cancer, well, they may not get treated at all. And so that would be a really bad outcome because they die because we told them that they don't have cancer.
They fail to get treated, but it turns out they actually have cancer. So, suppose that, when in doubt, we want to predict that y=1. So, when in doubt, we want to predict that they have cancer so that at least they look further into it, and these can get treated in case they do turn out to have cancer.
In this case, rather than setting higher probability threshold, we might instead take this value and instead set it to a lower value. So maybe 0.3. And by doing so, we're saying that if we think there's more than a 30% chance that they have cancer we better be more conservative and tell them that they may have cancer so that they can seek treatment if necessary.
And in this case what we would have is going to be a higher recall classifier, because we're going to be correctly flagging a higher fraction of all of the patients that actually do have cancer. But we're going to end up with lower precision because a higher fraction of the patients that we said have cancer, a high fraction of them will turn out not to have cancer after all.
The more general principle is depending on where you want, whether you want higher precision- lower recall, or higher recall- lower precision. You can end up predicting y=1 when h(x) is greater than some threshold. And so in general, for most classifiers there is going to be a trade off between precision and recall, and as you vary the value of this threshold that we join here, you can actually plot out some curve that trades off precision and recall.
Where a value up here, this would correspond to a very high value of the threshold, maybe threshold equals 0.99. So that's saying, predict y=1 only if we're more than 99% confident, at least 99% probability this one. So that would be a high precision, relatively low recall.
Where as the point down here, will correspond to a value of the threshold that's much lower, maybe equal 0.01, meaning, when in doubt at all, predict y=1, and if you do that, you end up with a much lower precision, higher recall classifier.
And as you vary the threshold, if you want you can actually trace of a curve for your classifier to see the range of different values you can get for precision recall. And by the way, the precision-recall curve can look like many different shapes. Sometimes it will look like this, sometimes it will look like that. Now there are many different possible shapes for the precision-recall curve, depending on the details of the classifier.
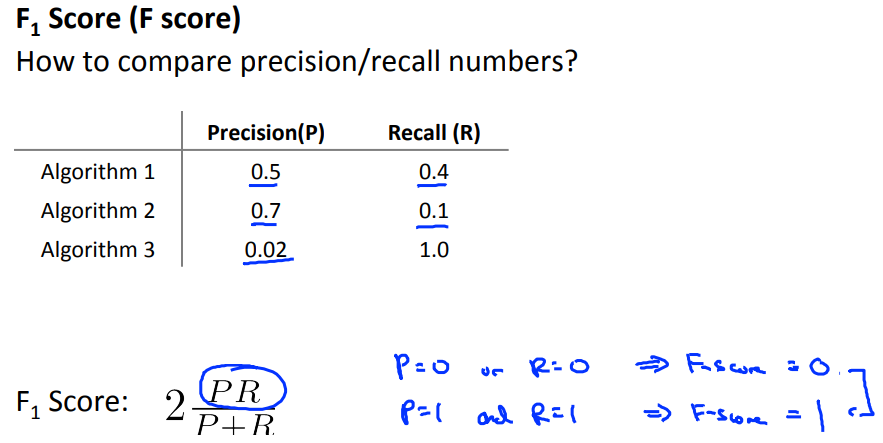
Concretely, suppose we have three different learning algorithms. So actually, maybe these are three different learning algorithms, maybe these are the same algorithm but just with different values for the threshold. How do we decide which of these algorithms is best? One of the things we talked about earlier is the importance of a single real number evaluation metric.
Hence, we use a way for combining precision and recall. This is called the F Score and it uses that formula. And so in this example, here are the F Scores. And so we would tell from these F Scores, it looks like Algorithm 1 has the highest F Score, Algorithm 2 has the second highest, and Algorithm 3 has the lowest. And so, if we go by the F Score we would pick probably Algorithm 1 over the others.
The F Score, which is also called the F1 Score. It is the harmonic mean between precision and recall.
Data for Machine Learning
We touch on another important aspect of machine learning system design, which will often come up, which is the issue of how much data to train on.
Although blindly going out and just spending lots of time collecting lots of data is useful because it's only sometimes that that would actually help.
But it turns out that under certain conditions getting a lot of data and training on a certain type of learning algorithm, can be a very effective way to get a learning algorithm to do very good performance.
And this arises often enough that if those conditions hold true for your problem and if you're able to get a lot of data, this could be a very good way to get a very high performance learning algorithm.
In a study of the effect of using different learning algorithms versus trying them out on different training set sciences. The performance of any algorithm monotonically increase and the fact that if you pick any algorithm may be pick a "inferior algorithm" but if you give that "inferior algorithm" more data, then from these examples, it looks like it will most likely beat even a "superior algorithm".
And this is, results like these has led to a saying in machine learning that often in machine learning it's not who has the best algorithm that wins, it's who has the most data.
Data for Machine Learning : Example
Consider a problem of predicting the price of a house from only the size of the house and from no other features.
So imagine I tell you that a house is, you know, 500 square feet but I don't give you any other features. I don't tell you that the house is in an expensive part of the city.
Or if I don't tell you that the house, the number of rooms in the house, or how nicely furnished the house is, or whether the house is new or old.
If I don't tell you anything other than that this is a 500 square foot house, well there's so many other factors that would affect the price of a house other than just the size of a house that if all you know is the size, it's actually very difficult to predict the price accurately.
So that would be a counter example to the assumption that the features have sufficient information to predict the price to the desired level of accuracy.
If we were to go to human expert in this domain. Like maybe an expert realtor, someone who sells houses for a living. If I just tell them the size of a house and I tell them what the price is well even an expert in pricing or selling houses wouldn't be able to tell me and so this is fine that for the housing price example knowing only the size doesn't give me enough information to predict the price of the house.
In such cases where the feaures are not informtive having more data does not help.
Data for Machine Learning : Example
Let's see then, when having a lot of data could help. Suppose the features have enough information to predict the value of y.
And let's suppose we use a learning algorithm with a large number of parameters so maybe logistic regression or linear regression with a large number of features.
Or use neural network with many hidden units. That would be another learning algorithm with a lot of parameters.
These are all powerful learning algorithms with a lot of parameters that can fit very complex functions. Hence, we call them low-bias algorithms because you know we can fit very complex functions and because we have a very powerful learning algorithm, they can fit very complex functions.
Chances are, if we run these algorithms on the data sets, it will be able to fit the training set well, and so hopefully the training error will be slow.
Now let's say, we use a massive, massive training set, in that case, if we have a huge training set, then hopefully even though we have a lot of parameters but if the training set is sort of even much larger than the number of parameters then hopefully these albums will be unlikely to overfit.
Because we have such a massive training set and by unlikely to overfit what that means is that the training error will hopefully be close to the test error. Finally putting these two together that the train set error is small and the test set error is close to the training error what this two together imply is that hopefully the test set error will also be small.
Another way to think about this is that in order to have a high performance learning algorithm we want it not to have high bias and not to have high variance.
So the bias problem we're going to address by making sure we have a learning algorithm with many parameters and so that gives us a low bias alorithm and by using a very large training set, this ensures that we don't have a variance problem here.
So hopefully our algorithm will have no variance and so is by pulling these two together, that we end up with a low bias and a low variance learning algorithm and this allows us to do well on the test set.
And fundamentally it's a key ingredients of assuming that the features have enough information and we have a rich class of functions that's why it guarantees low bias, and then it having a massive training set that that's what guarantees more variance.
In conclusion, if you have a lot of data and you train a learning algorithm with lot of parameters, that might be a good way to give a high performance learning algorithm
The key test that I often ask myself are first, can a human experts look at the features x and confidently predict the value of y. Because that's sort of a certification that y can be predicted accurately from the features x and second, can we actually get a large training set, and train the learning algorithm with a lot of parameters in the training set and if you can't do both then that's more often give you a very kind performance learning algorithm.