-
Chapter 4: ECONOMICS OF POVERTY
Introduction
Dadabhai
Nauroji
was the first to come up with a concept of the poverty line.
Post independence India saw the planning commission come up with
the mechanism to make a poverty line. The poor are categorized
as always poor, non poor, chronic poor [usually poor but may get
money occasionally], churning poor [they move in and out of
poverty] occasional poor / transient poor [rich who may become
poor due to bad luck].
HUMAN DEVELOPMENT INDEX - Mahbul-ul-Haq (Pakistan) and Amartya Sen (India)
HDI measures the average achievement in three basic dimensions of human development:
A long and healthy life as measured by life expectancy at birth.
Knowledge as measured by the adult literacy rate (with two third weight) and the combined primary, secondary and tertiary gross enrollment ratio (with one third weight)
A decent standard of living as measured by GDP capita (PPP US$).
Before calculating HDI, an index for each of the dimensions is created. For this purpose, maximum minimum values are chosen for each indicator.
Performance in each of the indices is calculated as a value between 0 and 1.
HDI is then the simple average of the indices.
Countries have been grouped under three categories:
Countries in the HDI range 0.8 and above are in the very High Human Development group;
Countries in HDI range 0.7 to 0.8 are in the High Human Development group;
Countries in the HDI range 0.5 to 0.7 are in the range of Medium Human Development group
Countries in the HDI range less than 0.5 are in the Low Human Development group
HDI - 2010
Knowledge dimension was earlier measured based on literacy and gross enrolment.
This has been replaced by mean years of schooling and expected of schooling respectively.
To measure the standard of living: gross national income (GNI) per capita replaces the earlier variable namely gross domestic product (GDP) per capita.
It found no viable and better alternative to life expectancy at birth. Thus as an indicator of health, life expectancy at birth has been retained.
Earlier a simple mean of three dimensions was taken to measure HDI. A key change in HDR 2010 is that of shift to a geometric mean (which measures the typical value of a set of numbers); thus in 2010 the HDI is the geometric mean of the three dimension indices.
GENDER INEQUALITY INDEX (GII)
The Gender Inequality Index (GII) is another newly introduced index in the 2010 Global Human Development Report and outlines disadvantages for women in four areas:
reproductive health
education
empowerment
labour market
It highlights losses in human development due to inequalities between men and women.
The index ranges from 0, indicating that women and men fare equally, to 1, indicating that women fare as poorly as possible in all measured dimension
HUMAN POVERTY INDEX (HPI)
Human Poverty Index, which concentrates on deprivation in three essential elements of human life already reflected in HDI - longevity, knowledge and a decent living standard.
The first deprivation is vulnerability to death at relatively early age and is represented in the HPI by percentage of people expected to die before age 40.
The second deprivation is related to knowledge and is measured by the percentage of adults who illiterate
The third deprivation relates to a decent standard of living, in particular, overall provisioning. This represented by a composite of three variables percentage of people with access to
health services,
to safe water,
the percentage of malnourished children under five
Multi dimensional poverty index: U.N.D.P
It calculates intensity * incidence. It has replaced the Human poverty index.
Incidence: Health, Education and standard of living
Intensity: How many indicators do households lack
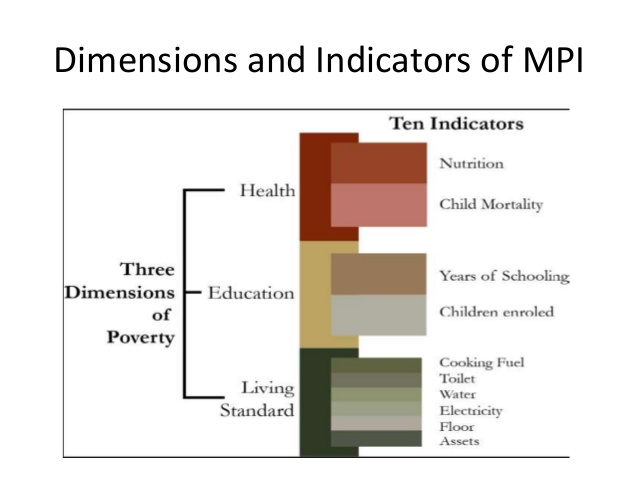
Fig 1: Multidimensional poverty index
G.I.N.I Coefficient:
It varies from 0 - 1. 0 is good and 1 is bad. It is published by World Bank. India has G.I.N.I coefficient of 0.33 which is higher than USA, B.R.I.C.S but less than Germany, Japan.
Fig
2: G.I.N.I Coefficient
Concepts of macroeconomics:
Consumption goods: these are consumed by their final purchasers like food and drinks or services like recreation.
Capital goods: these are of durable character which is used in the production process. These goods form a part of the capital and they continue to enable the production process to go on for continuous cycles of production.
Consumer durables: these are consumer goods but which have a longer durability as they are not extinguished by short or intermediate use.
All the above are final goods as they don’t undergo any transformation in the economic process. Intermediate goods are those that used as raw materials or inputs for production of other commodities.
Depreciation is the deletion from the value of gross investments in order to accommodate regular wear and tear of capital.
Net investment = gross investment – depreciation
Circular flow of income: the consumption and production process are linked. The process of production generates factor payment for those involved in the production process and generates goods and services as an outcome. These are then consumed by those who receive the income from factor payments.
Consider in the economy a single household and a single factory. If the household works for the factory then the factory pays it and this income is used by the household to buy the goods of the factory and thus the cycle continues. It the income in this cycle has to be calculated then there are multiple ways.
The income of the economy can be calculated by the total spending it has done on the goods. This method is the expenditure method. If we calculate the income by measuring the total value of goods produced then it is the product method. And if calculated by the total value of payments made by the factory then it’s the income method.
Product method:
GDP = sum total of gross value added for all firms in the economy.
GDP = total value of sale – cost of intermediate inputsNDP = GDP - depreciation
Expenditure method:
GDP = sum total of final expenditures received by all firms in the economy
GDP = consumption + investment + government purchase + net trade balance
Income method:
GDP = sum total of factor payments made by firms in the economy
Central statistics organization [C.S.O]:
It is calculating GDP since 1955. There are three sectors in Indian economy primary, secondary and tertiary.
CSO utilizes data from the following sources:
- Annual survey of industries, NSSO surveys, economic census, IIP
- Central board of direst taxes, CBEC, CPI– indexes.
The GDP was being calculated based on income or factor cost method but from 2015 onwards the reforms were put in it.
- The salary or wages component now contains EPFO contribution by employer
- The workers would earn wage and the entrepreneurs would earn profit but for informal, family owned unorganized agro cottage industry the concept of mixed income / operating surplus was developed.
- From above sources we add production taxes and subtract production subsidies to get gross value added at basic prices.
GVA [market price] = GVA [basic prices] + product taxes – product subsidies
- The GVA [market price] adjusted for inflation becomes our official GDP.
The poverty alleviation schemes are of two types i.e. In kind income
transfers and cash transfers. The in kind income transfers allow for poverty reduction by provision
of resources to the needy, that are required for their sustenance. Two
major such schemes are [National Rural Employment Guarenteee Act]
MNREGA and the FSA [National Food security Act]. However, Study after study have revealed that out of the subsidised
food around 15% reaches the beneficiaries and around 50% is siphoned
off by the liquor mafia, corrupt officials, food mills etc. Even in
MNREGA jobs and income are alleged to be allocated to ghost workers
and panchayat leaders. These two schemes contribute black money in
quantity of 1% of the GDP. A solution to the problem of elimination of leakages is the system of
Universal Basic Income - A guarenteed minimum income to all
population. This has become possible due to growth in technology and
implementation of Aadhar Enabled Payments Systems. The Tendulkar poverty line estimates have become obsolete as the Per
capital consumption of a person per month has exceeded that estimated
by the poverty line. This poverty gap i.e. Difference between the
average consumption level and the relevant poverty line can be reduced
by an implementation of Universal basic income. Due to significant increase in collections of direct taxes, the scheme
could cost the government Rs. 1 lakh crore annually far less than the
Rs. 1.75 lakh crore cost of the MNREGA + FSA. The impact of such a
scheme on the poor shall be greater than the effect of the in-kind
income transfer schemes.
Universal Basic Income
UPSCFEVER - POPULAR PAGES
Join The Movement
Discussions and Comments