LINE-GRAPHS
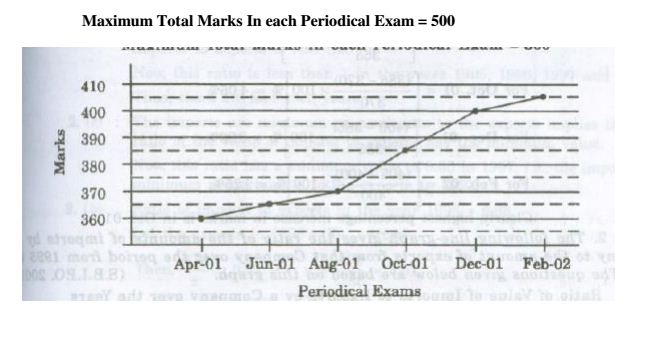
In a school the periodical examination are held every second month. In a session
during Apr. 2001 -Mar. 2002, a student of Class IX appeared for each of the periodical exams. The aggregate marks
obtained by him in each periodical exam are represented in the line-graph given below. Study the graph and answer
the questions based on it.(S.B.I.P.O 2003)
MARKS OBTAINED BY A STUDENT IN SIX PERIODICAL EXAMS HELD IN EVERY TWO MONTHS DURING THE YEAR IN THE SESSION 2001-02
Ans .
112.5%
- Explanation :
Required percentage = [(405/360)*100] % = 112.5 %
Ans .
381
- Explanation :
Average marks obtained in all the periodical exams.
= (1/6)*[360+370+385+400+404] = 380.83 = 381.
Ans .
78.75%
- Explanation :
Required percentage = [(370+385)/(500+500) * 100] % = [(755/1000)*100]% =75.5%
Ans .
none
- Explanation :
As is clear from graph, the total marks obtained in periodical exams, go on increasing.
Since, the maximum marks for all the periodical exams are same , it implies that the percentage of marks also goes on increasing. Thus,
in none of the periodical exams, there is a fall in percentage of marks compared to the previous exam.
Ans .
Oct. 01
- Explanation :
Percentage increases in marks in various periodical exams compared to the previous exams are:
For Jun. 01 = [(365-360)/360 * 100 ] % = 1.39 %
For Aug. 01 = [(370-365)/365 * 100 ] % = 1.37 %
For Oct. 01 = [(385-370)/370 * 100 ] % = 4.05%
For Dec. 01 = [(400-385)/385 * 100 ] % = 3.90 %
For Feb. 02 = [(405-400)/400 * 100 ] % = 1.25 %
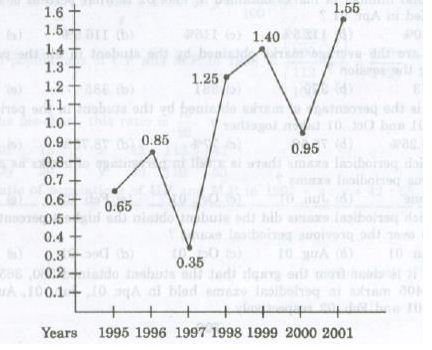
The following line- graph the ratio of the amounts of imports by a Company to the amount of exports from that Company over the period from 1995 to 2001. The questions given below are based on this graph. (S.B.I.P.O 2001)Ratio of value of Import to Export by a Company over the Years
Ans .
4
- Explanation :
The exports are more than the imports implies that the ratio of value of imports to exports is less than 1.
Now, this ratio is less than 1 in the years 1995,1996,1997 and 2000. Thus, there are four such years.
Ans .
1997
- Explanation :
The imports are minimum proportionate to the exports implies that the ratio of the
value of imports to exports has the minimum value.
Now, this ratio has a minimum value of 0.35 in 1997, i.e., the imports are minimum proportionate to the exports in 1997.
Ans .
b.Rs.320 crores
- Explanation :
Ratio of imports to exports in the years 1996=0.85.
Let the exports in 1996=Rs.320 crores.
Then,272/x =0.85 implies x=272/.85 = 320..
Ans .
Data inadequate
- Explanation :
The graph gives only the ratio of imports to exports for different
years. To find the percentage increase in imports from 1997 to 1998, we require more details such as the
value of imports or exports during these years. Hence, the data is inadequate to answer this question.
Ans .
d.Rs 420 crores
- Explanation :
The ratio of imports to exports for the years 1998 and 1999 are 1.25 and 1.40 respectively.
Let the exports in the year 1998 = Rs. x crores
Then, the exports in the year 1999=Rs(500-x) crores.
1.25=250/x implies x=250/1.25=200
Thus the exports in the year 1999=Rs. (500-200)crores=Rs.300 crores
Let the imports in the year 1999=Rs. y crores
Then, 1.4=y/300 implies y=(300*1.4)=420.
Imports in the year 1999=Rs.420 crores..
Study the following line-graph and answer the question based on it.Number of vehicle Manufactured by Two Companies over the Years
(Numbers in thousands)
Ans .
26000
- Explanation :
Total production of Company X from 1997 to 2002
= 119000+99000+141000+78000+120000+159000 = 716000
and total production of Company Y from 1997 to 2002
=139000+120000+100000+128000+107000+148000=742000
Difference=742000-716000=26000.
Ans .
21000
- Explanation :
Require difference = 128000-107000 = 21000.
Ans .
119333
- Explanation :
Average number of vehicles manufactured by Company X
= (91/6)* (119000 + 99000 + 141000 + 78000 + 120000 + 159000) = 119333.
Ans .
2000
- Explanation :
The difference between the production of Companies X and Y in various years are.
For 1997 = (139000 -119000) = 20000;
For 1998 = (120000 -99000) = 21000;
For 1999 = (141000 -100000) = 41000;
For 2000 = (128000 -78000) = 50000;
For 2001 = (120000 -107000) = 13000;
For 2003 = (159000 -148000) = 11000;
Clearly, maximum difference was in 2000
Ans .
164
- Explanation :
Required percentage = [( 128000/78000)* 100] % = 164 %.
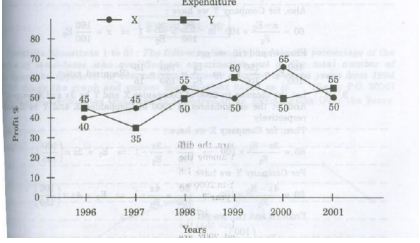
The following line-graph gives the percent profit earned by two Companies X and Y
during the period 1996 -2001. Study the line -graph and answer the questions that are based on on it.
Percentage Profit Earned by Two Companies X and Y over the Given years % profit/ loss = [(Income -Expenditure) / Expenditure] * 100
Ans .
(b). Rs. 297 crores
- Explanation :
Profit percent ofcompany Y in 1997=35.
Let the income of company Y in 1997 be Rs.x crores
Then,35 = \(\frac{x-220}{220}\) X 100 =>x =297
Income of company Yin 1997 = Rs.297crores.
Ans .
16:15
- Explanation :
Let the incomes of the twocompanies X and Yin 1999 be Rs.x and let the
Expenditures of companies X and Y in 1999 be E1 and E2 respectively
Then, for Company X we have:
50= \(\frac{x-E1}{E1}\) x 100 => \(\frac{50}{100}\) = \(\frac{x}{E1}\) -1 => x = \(\frac{150}{100}\) E1
Also, for the Company Y we have:
60 = \(\frac{x-E2}{E2}\) *100 =>\(\frac{60}{100}\) = \(\frac{x}{E2}\) -1 =>x = \(\frac{160}{100}\) E2
From (i) and (ii),we get
\(\frac{150}{100}\) E1=\(\frac{160}{100}\) E2 => \(\frac{E1}{E2}\) = \(\frac{160}{150}\)= \(\frac{16}{15}\)(Required ratio).
Ans .
15:22
- Explanation :
Let the incomes in 2000 of companies X and Y be 3x and 4x respectively.And let
the expenditure in 2000 of companies X and Y be E1 and E2 respectively.
Then, for company X we have:
65= \(\frac{3x-E1}{E1}\) x 100 => \(\frac{65}{100}\) = \(\frac{3x}{E1}\)-1 =>E1=3x *\(\frac{100}{165}\)
For company Y we have:
50 = \(\frac{4x-E2}{E2}\) *100 => \(\frac{50}{100}\) = \(\frac{4x}{E2}\)-1 =>E2 = 4x* \(\frac{100}{150}\)
From (i)and(ii) we get:
\(\frac{E1}{E2}\) = \(\frac{3x*(100/165)}{4x*(100/150)}\) =\(\frac{3* 150}{4*165}\) =\(\frac{15}{22}\) (Required ratio)
Ans .
Rs.102crores
- Explanation :
Let the expenditures of each of the Companies X and Y in 1996 be
Rs.xcrores.And let the income of Company X in 1996 be Rs.zcrores so that the income of Company Y in 1996 =Rs.(342-z)crores.
Then,for company X we have:
40= \(\frac{z-x}{x}\) *100 => \(\frac{40}{100}\) =\(\frac{ z}{x}\) -1 => x = \(\frac{100z}{140}\)
Also for company Y we have:
45= \(\frac{(342-z)-x}{x}\) *100 => \(\frac{45}{100}\)= \(\frac{ (342-z)}{x}\) -1 =>x = \(\frac{(342 –z)}{145}\)* 100
From(i)and (ii) we get:
\(\frac{100z}{140}\) = \(\frac{(342-z)*100}{145}\) =>z = 168
Substituting z=168 in (i),we get: x=120
Total expenditure of companies X and Y in 1996=2x=Rs.240crores.
Total income of companies X and Y in 1996=Rs.342 crores.
Total profit =Rs.(342-240)crores =Rs.102 crores
Ans .
Rs.465crores
- Explanation :
Let the income of company X in 1998 be Rs.x crores.
Then,55= \(\frac{x-200}{200}\) *100 => x = 310.
Expenditure of Company X in 2001= Income of company X in 1998 = Rs.310crores
Let the income of company X in 2001 be Rs.z crores
Then,50 = \(\frac{z-310}{310}\) *100 =>z = 465.
Income of company X in 2001 = Rs.465 crores.