BAR GRAPHS
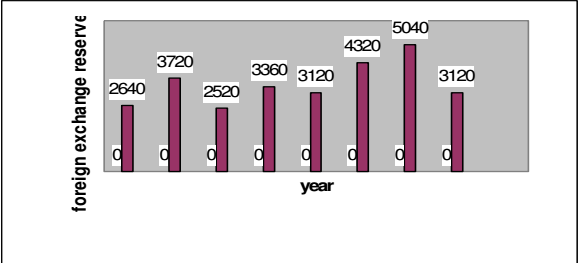
The bar graph given below shows the foreign exchange reserves of a country(in million us$)
from 1991-92 to 1998-99 .answer the questions basedon this graph.
Ans .
1.5
- Explanation :
required ratio = 5040/3360 = 1.5
Ans .
100%
- Explanation :
foreign exchange reserve in 1997-98=5040 million us $
foreign exchange reserves in 1993-94=2520 million us$
therefore increase=(5040-2520)=2520 million us $
therefore percentage increase=((2520/2520)*100)%=100%
Ans .
1992-93
- Explanation :
there is an increase in foreign exchange reserves during the years 1992-
93,1994-951996-97,1997-98 as compared to previous year (as shown by bar graph)
the percentage increase in reserves during these years compared to previous year are
(1) for 1992-93 =[(3720-2640)/2640*100]% =40.91%
(2) for 1994-95=[(3360-2520)/2520*100]%=33.33%
(3) for 1996-97=[(4320-3120)/3120*100]%=38.46%
(4) for 1997-98=[(5040-4320)/4320*100]%=16.67%
Clearly, the percentage increase over previous year is highest for 1992-93.
Ans .
125%
- Explanation :
Average foreign exchange reserves over the given period
= [_x (2640 + 3720 + 2520 + 3360 + 3120 + 4320 + 5040 + 3120) ] million US $
= 3480 million US $.
Foreign exchange reserves in 1996-97 = 4320 million US $. . .
Required Percentage = x 100 % = 124.14% .. 125%. 3480 .
Ans .
3:5
- Explanation :
Average foreign exchange reserves over the given period = 3480 million US $.
The country had reserves above 3480 million US $ during the years 199293,1996-97 and 1997-98 i.e., for 3 years and below 3480 million US $ during the
years 1991-92, 1993-94, 1994-95, 1995-96 and 1998-99 i.e., for 5 years.
Hence, required ratio = 3 : 5.
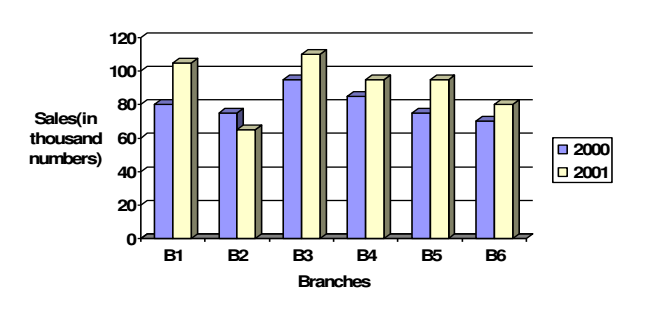
bar-graph provided on next page gives the sales of books (inthousand numbers) from six branches of a publishing company during two
consecutive years 2000 and 2001. Answer the questions based on this bargraph:
Ans .
560
- Explanation :
total sales of branches B1,B3 and B5 for both the years (in thousand
numbers)=(80+105)+(95+110)+(75+95)=560
Ans .
73.17%
- Explanation :
required percentage=[(70+80)/(95+110)*100]%=(150/205*100)%=73.17%
Ans .
80
- Explanation :
average sales of all the six branches (in thousand numbers ) for the year 2000=1/6*(80+75+95+85+75+70)=80
Ans .
7/9
- Explanation :
required ratio=(75+65)/(85+95)=140/180=7/9
Ans .
87.5%
- Explanation :
average sales(in thousand numbers of branches B1,B3,and B6 in 2000=
1/3*(80+95+70)=245/3
average sales(in thousand numbers of branches B1,B2,and B3 in
2001=1/3*(105+65+110)=280/3
therefore required percentage=[((245/3)/(280/3))*100]%=(245/280*100)%=87.5%
The bar graph provided below gives the data of the production of paper(in thousand tonnes) by three different companies x,y and z over the years .study
the graph and answer the questions that followproduction of paper(in laks tonnes) by three companys x,yand z over the years

Ans .
2,00,00,000 tons
- Explanation :
required difference =[(45-25)*1,00,000]tons=20,00,000 tons.
Ans .
Rs. 912
- Explanation :
average production of company x in the period 1998-
2000=[1/3*(25+50+40)]=(115/3) lakh tons average production of company y in the period 1998-2000
s[1/3*(35+40+50)]=(125/3) lakh tonstherefore req ratio=(115/3)/(125/3)=115/125=23/25
Ans .
60%c
- Explanation :
percentage increase in the production y from 1996-1999=[(40- 25)/25*100]%=(15/25*100)%=60%
Ans .
x and z both
- Explanation :
average production (in lakh tons)in five years for the three company's are:
for company x=[1/5*(30+45+25+50+40)]=190/5=38
for company y=[1/5*(25+35+35+40+50)]=185/5=37
for company z=[1/5*(35+40+45+35+35)]=190/5=38
therefore the average production of maximum for both the company's x and z
Ans .
1997
- Explanation :
Percentage change (rise/fall)in the production of Company Y in comparison
to the previous year, for different years are:
For 1997 = [((32-25)/25)*100]% = 40%
For 1998 = [((35-35)/25)*100]% = 0%
For 1999 = [((40-35)/35)*100]% = 14.29%
For 2000 = [((50-40)/40)*100]% = 25%
Hence, the maximum percentage rise/fall in the production of company Y is for 1997.
Ans .
1996
- Explanation :
The percentages of production of company z to the production of company
z for various years are:
For 1996 = ((35/25)*100)%=140%; For 1997 = ((40/35)*100)% = 114.29%
For 1998 = ((45/35)*100)%=128.57%; For 1999 = ((35/40)*100)%=87.5%
For 2000 = ((35/50)*100)%=70%
Clearly, this percentage is highest for 1996.

Ans .
1996
- Explanation :
The percentage increase in the amount invested in raw-materials as
compared to the previous year, for different years are:
For 1996 = [((225-120)/120)*100]% = 87.5%
For 1997 = [((375-225)/225)*100]% = 66.67%
For 1998 = [((525-330)/330)*100]% = 59.09%
For 2000 there is a decrease.
Ans .
1997
- Explanation :
The percentage change in the amount invested in raw-materials and in the
value of sales of finished goods for different years are:
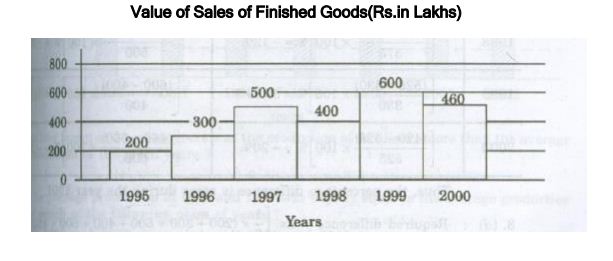
in year 1996 Percentage change in amount invested in raw-materials[((225-120)/120)*100]% = 87.5%
Percentage change in value of sales of finished goods[((300-200)/200)*100]% = 50%
in year 1997 Percentage change in amount invested in raw-materials[((375-225)/225)*100]% = 66.7%
Percentage change in value of sales of finished goods[((500-300)/300)*100]% = 66.67%
in year 1998 Percentage change in amount invested in raw-materials[((525-330)/330)*100]% = -12%
Percentage change in value of sales of finished goods [((400-500)/500)*100]% = -20%
in year 1999 Percentage change in amount invested in raw-materials[((525-330)/330)*100]% = 59.09%
Percentage change in value of sales of finished goods[((600-400)/400)*100]% = 50%
in year 2000 Percentage change in amount invested in raw-materials[((420-525)/525)*100]% = -20%
Percentage change in value of sales of finished goods [((460-600)/600)*100]% = -23.33%
Thus the percentage difference is same during the year 1997
Ans .
Rs.77.51akhs
- Explanation :
Required difference = Rs. [(1/6)*(200+300+500+400+600+460)- (1/6)*(120+225+375+330+525+420)] lakhs
= Rs. [(2460/6)-(1995/6)] lakhs = Rs.(410-332.5)lakhs = 77.5 lakhs.
Ans .
49%
- Explanation :
Required percentage = [(600/(375+300+525))*100]% = 48.78% =>49%
Ans .
1997
- Explanation :
The difference between the amount invested in raw-material and the value
of sales of finished goods for various years are :
For 1995 = Rs.(200-120)lakhs = Rs. 80 lakhs
For 1996 = Rs.(200-225)lakhs = Rs. 75 lakhs
For 1997 = Rs. (500-375)lakhs = Rs. 125 lakhs
For 1998 = Rs. (400-330)lakhs = Rs. 70 lakhs.
For 1999 = Rs. (600-525)lakhs = Rs. 75 lakhs
For 2000 = Rs. (460-420)lakhs = Rs. 40 lakhs.
Clearly, maximum difference was during 1997
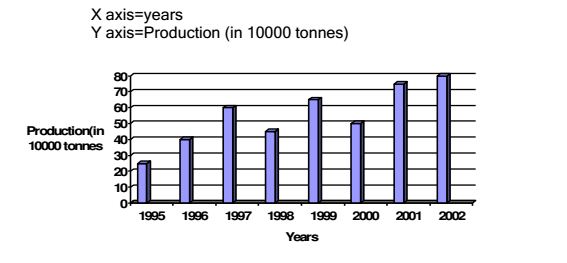
Directions(questions 1 to 4) : study the following bar-graph and answer the questions given below.
Production of fertilizers by a Company (in 10000 tonnes) over the Years
Ans .
5
- Explanation :
average production of each year=\(\frac{25+40+60+45+65+75+80}{8}\)=48.75=49
Ans .
1995 and 1999
- Explanation :
average production of 1996 and 1997=\(\frac{40+60}{2}\)=50
average of 2000 and 2001=\(\frac{50+75}{2}\)=62.5
average of 1999 and 2000=\(\frac{65+50}{2}\)=57.5
average of 1998 and 2000=\(\frac{45+50}{2}\)=47.5
average of 1995 and 1999=\(\frac{25+75}{2}\)=50
Ans .
25%
- Explanation :
increase=60-45=15
%increase=(15/60)*100=25%
Ans .
2001
- Explanation :
the percentage increase in production as compared to the
previous year is maximum in 2001